You get an assessment of your registration site's efficiency with statistics found below quick start cards on the Dashboard and in Report Manager.
# Statistics Dashboard
The dashboard opens when you log in to QuickReg. To access the dashboard at any time, in the left-side navigation panel, click Applications > Dashboard.
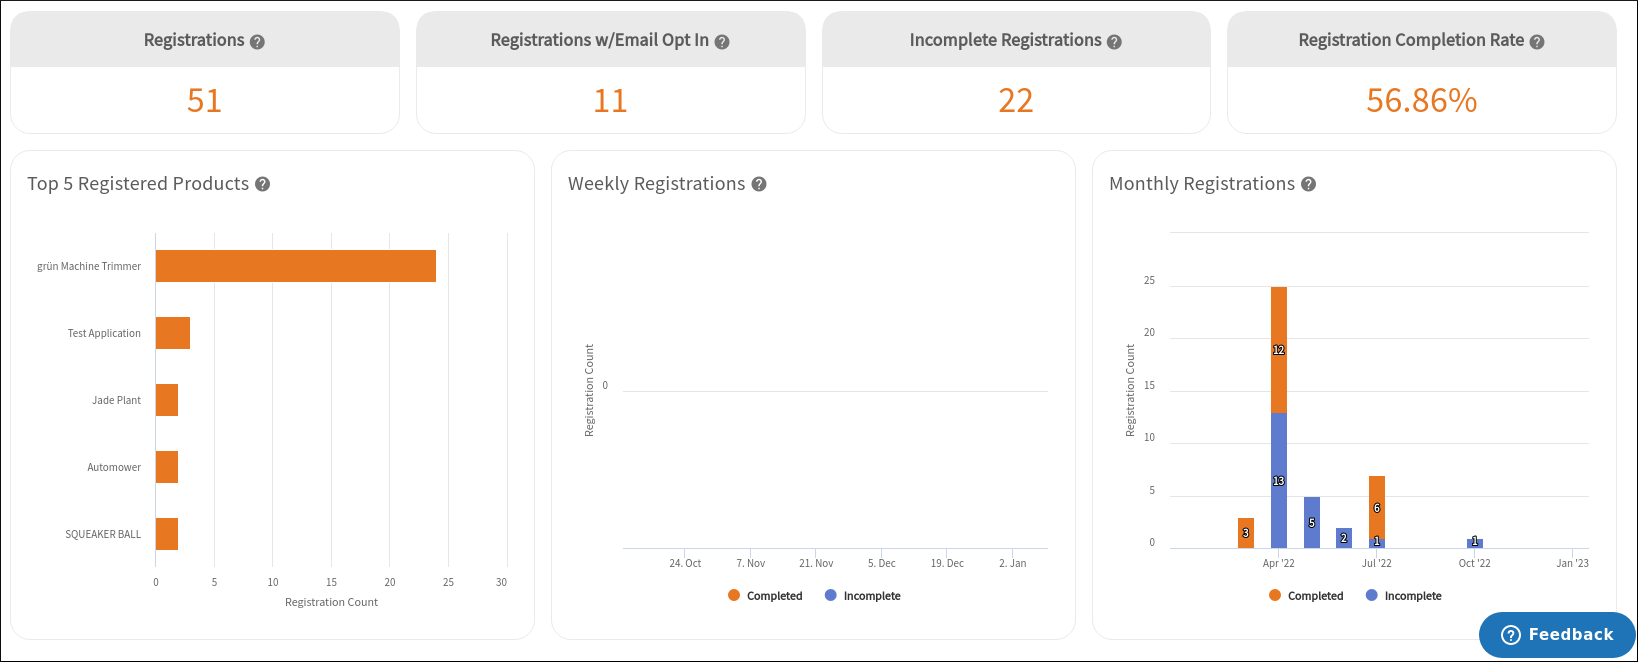
Four registration metrics help you get a high-level picture of the activity on your registration page.
- Registrations: The total number of product registrations completed by customers to date.
- Registrations with Email Opt-In: The number of customers who completed a product registration and agreed to receive email updates from you.
- Incomplete Registrations: The number of users who started a product registration and didn't finish it.
- Registration Completion Rate: This metric shows the percentage of all registrations successfully completed.
The three bar charts provide details of the product registration activity on your page.
- Top 5 Registered Products: Registration numbers for the five products registered most often.
- Weekly Registrations: The number of completed registrations by week.
- Monthly Registrations: The number of completed registration by month.
# Report Manager
To see a graph of registration counts, in the left-side navigation panel, click Applications > Report Manager.
NOTE
To use Report Manager, you must be a member of the Report Manager Users group. To learn how to update user group membership, read Access Permissions.
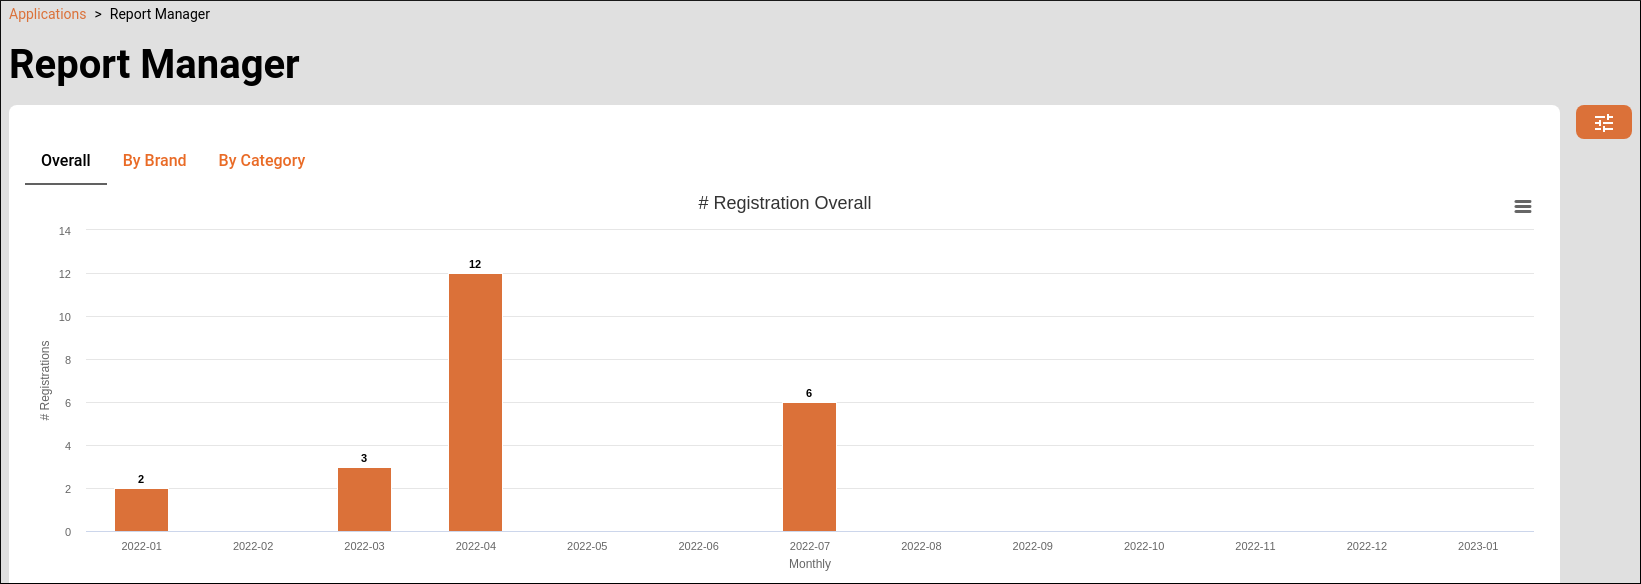
The Report Manager offers three graphs:
- Overall
- By Brand
- By Category
To switch between graphs, click the titles at the top.
To filter graph data, use the Control Bar on the right.
# Using the Control Bar
NOTE
If the Control Bar is minimized, click  .
.
To set a custom date range:
- Click the date fields at the top of the Control Bar. A calendar drop-down opens.
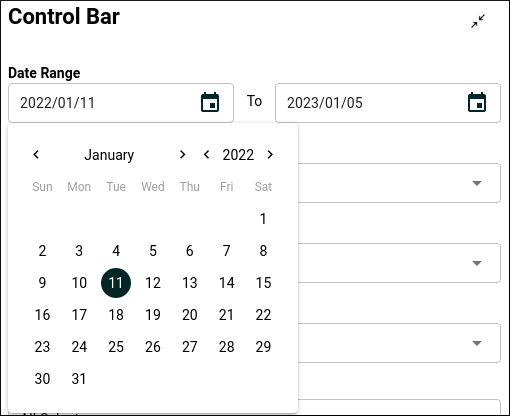
- Use the calendar controls to set the dates, or type in the dates manually.
To switch between a line graph and a bar graph, use the Chart Type control.
To change the time interval of the graph, use the Time Scale control. The registration numbers can be displayed as daily, weekly, monthly, quarterly or yearly.
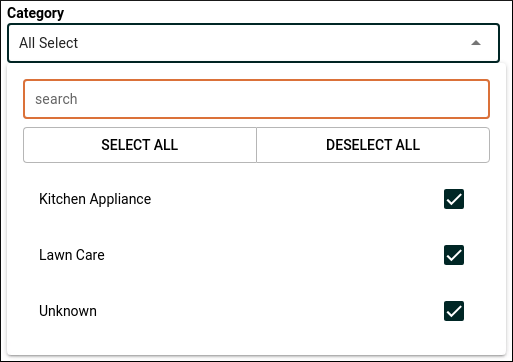
You can filter the graph by product brand, category, or model:
- Click the Brand, Category, or Model drop-down in the Control Bar.
- Select the values by checking the boxes in the drop-down list.